Feel free to write us
a message.

Reporting of the StockPicking system 6/2020 – 5/2021
event_note 31.05.2021
It has been a year (03. 06. 2020 – 28. 05. 2021) already since we started trading with our “StockPicker” strategy on real Interactive Broker accounts. Therefore, we bring more detailed results, including graphs and comparisons with a benchmark, in our case the S&P 500 Index.
First, let’s recall how our strategy works:
- Based on the analysis of company-specific predictors and macro-predictors, we compile a ranking of shares from the S&P 100 index every month, which are ranked from relatively most undervalued to relatively most overvalued.
- In the second step, we buy the 20 most undervalued shares in the Long position and sell (Short) the 20 most overvalued shares. All this using leverage 1.5 (performance = longs * 1.5 * 3/5 – shorts * 1.5 * 2/5).
- At the beginning of each month, we rebalance the portfolio. The goal is to achieve an annual performance of 17.69% over a long period of time and minimize portfolio losses.
- More on how the model works.
The results are presented on an initial portfolio of CZK 250,000:
- On a real margin account, which includes IBKR fees as well as Forex (it is held in Czech crowns). Due to limited capital, the same shares are not always bought as in the ideal portfolio, and we do not always enter the market with its opening *. Detailed results.
- On a ideally calculated portfolio that best matches the benchmark comparison. It should be noted that the results of both approaches differ slightly *.
Overall portfolio performance:
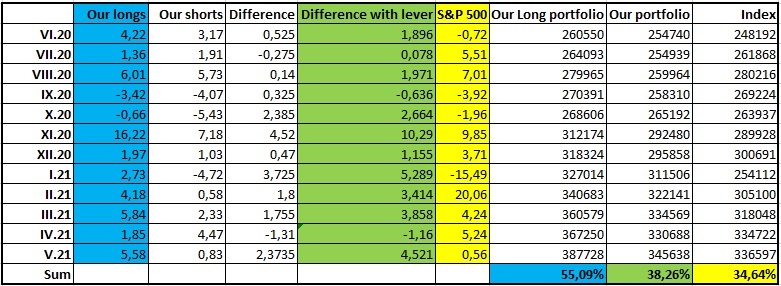
- On the real account, we achieved an appreciation of 32.64% for the given period, if we did not calculate Forex and IBKR fees, the appreciation would be 39.22% *.
- The performance of the ideally calculated portfolio was 38.26%.
- The performance of the index for the same period was 34.64%.
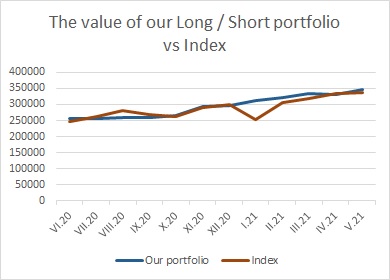
The chart shows the movement of the ideal portfolio in comparison with the Benchmark. As can be seen, StockPicker achieved more stable results = lower declines and, due to the Short component, significantly eliminated the portfolio slump at the beginning of 2021.
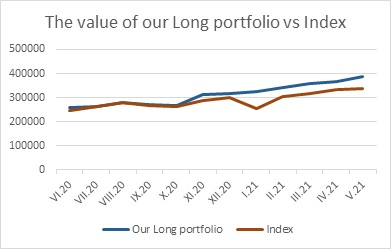
If we decided to implement only the strategy of buying the 20 most undervalued shares (we would not implement Shorts), the results would be as follows:
- The performance of the portfolio would be 55.09%.
- The performance of the index for the same period was 34.64%.
In conclusion, it can be stated that in the first year of real use, StockPicker fulfils the task, the strategy exceeds the benchmark, and achieves lower declines. When choosing a riskier strategy, which is still composed of a portfolio of 20 companies from the index of the 100 largest American companies, an appreciation of over 50% would be achieved.
* In the real portfolio, it must be said that we exited the market during the US presidential election. The index has achieved a significant appreciation at this time. On the other hand, it helped that we did not have sufficient funds for BigTech shorts, for example, that would worsen real results. We have already solved the calculation of BigTechs indicators in the next version of the StockPicking model.
The current stock report is available in the analyticalplatform.com application.