Feel free to write us
a message.
Price patterns
event_note 07.05.2019
Abstract
In today’s article, we will have a look at the price development analysis which has been known for centuries – technical analysis. We will, however, look at it from a different point of view than usual – via market logic which is hidden behind the technical analysis. Within our applications for revealing and using trading strategies, we have been developing PatternLab software whose foundations are based on the technical analysis.
Patterns in price movement behaviour – where do they come from and how to use them?
The basis of systems used for trading on financial markets is usually a particular pattern in price movement behaviour, which tends to be repeated and it is, therefore, becomes something which can be called a systematic error. These errors (interferences) in data are created by specific repeated behaviour of strong market participants; to understand them, it is important to have at least basic knowledge of the market microstructure (= understanding terms such as market participant, command types, order book and depth of market).
An example of a specific price behaviour pattern (double bottom, technical analysis)
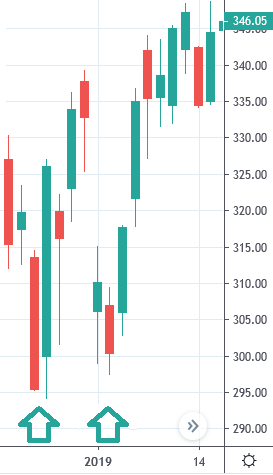
Repeated price patterns are an accompanying phenomenon which reflects behaviour (buy/sell) of a market participant which has the power to move the market price of the asset being bought/sold when performing their buys and sells, where this accompanying phenomenon does not have to be noticed by the very market participant at all. As an example, let’s take an imaginary pension fund which at 11:00 adjusts its positions of “S” company stock, for instance, it will liquidate its positions (selling them). Liquidation of large positions is often administered by easy algorithms which set the timing of sales and compartmentalise them in such a way not to create price pressure, which would be damaging the very order executor (they would be selling for a lower price). Technically speaking, the market participant – the pension fund, sends a considerable amount of sale orders to the stock-exchange order book, thereby creates pressure on the price drop. Considering the fact that they know about the situation, the orders are sent to the order book in time intervals so that the impact of their doing on the asset price is as low as possible. The price pattern, which you can see in the picture above, is created as a side effect of this process.
Such systematic errors are created in different time frameworks, in different forms. There can be, of course, various reasons for the creation of such a price pattern, some of which can be exactly observed (in contrast to our example where the process can be observed but the specific cause could be identified with large difficulties), for example, reaction to the announcement of a company’s quarterly results. The table below shows an example of changes in some macroeconomic variables which can lead to the creation of a price pattern.
Changes in economic data
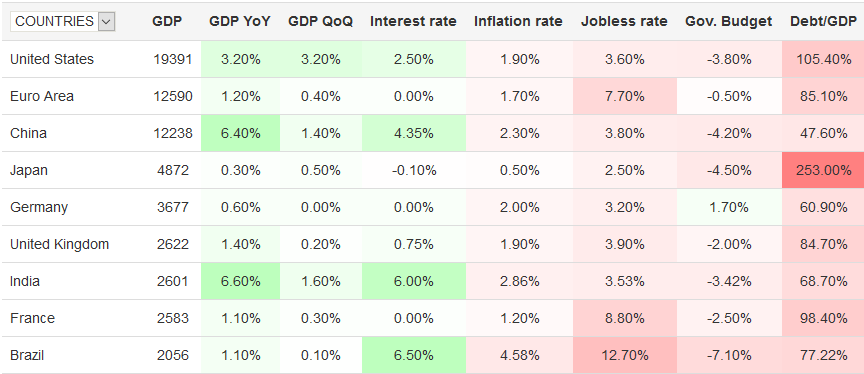
Source: https://tradingeconomics.com/
The business idea, based on the observation of price patterns, is very simple: if I observe a particular pattern (systematic error) in the price development, I receive market information about an emerging familiar situation and I know that I am observing a process in which I know what exactly is happening on the market. Traders call this situation “find your market”. Using this situation is intuitive – if I know who, why and what actions is someone performing in the market, I can place my own trade order according to the situation in a way so that I can participate in the price movement. As I already outlined in one of the previous posts, using this trading opportunity, we do not rely on outputs of prediction models but it is a reaction on the current situation, or more precisely, revealing and using a newly-emerged trading opportunity.
Practical use
Our team are developing an application which can help you when searching your preferred price patterns by scanning thousands of titles and testing whether the occurrence of these price patterns is statistically significant, which will save you a lot of time on studying and scanning markets. In addition, the application is equipped with a function which will instantly inform you every time whenever your tracked market records the preferred price pattern, it will, thereby, ensure you never miss a trading opportunity. After having created the overall application workflow, the research on patterns being shown in the application is reaching the peak. Once the library with predefined patterns has been finished, the final production environment will be created.
If you are interested in more information about our service, do not hesitate to contact us.