Feel free to write us
a message.

Pairs formation approaches
event_note 25.03.2019
One of the previous contributions “RelativeValues Lab principles” dealt with a brief description of the partial problems that software for creating trading strategy based on Relative Value approach should allow to solve. A key step in such a strategy is the identification of pairs of sufficiently similar assets. This is a very unspecified concept and therefore this step can be implemented in different ways. In order to have the searched pairs as stable as possible, it makes sense first to filter out the assets that are unsuitable for pair trading because they have very little in common (technically, economically, politically, etc.) despite their temporary (random) behavior can be similar. Initial selection can be done through various easily available indicators (descriptive and fundamental, but technical indicators can be used for these purposes too). … Among the pre-selected candidates, the pairs of those who have historically moved as much as possible together are being sought.
Several procedures based on different mathematical and statistical methods can be used for co-movements testing of time series pairs:
- value differences correlation – one of the historically first methods for the detection of potential couples, which has already been briefly presented in one of the previous contributions (The Relative Value Approach) and a more detailed summary of its outputs analysis was posted by another contribution (Walk forward test of correlated pairs)
- distance minimization – co-movement is sought as the lowest sum of squared differences between normalized series
- co-integration analysis – one series in a pair is a linear combination of the second series
- stochastic spread analysis – it assumes that the price spread oscillates around the long-term average
The output of the analysis of correlation between the time series values differences tells about the strength of the common movement match, so that series with a high correlation of value differences can move away from each other (eg. both grow, while one grows faster) and no longer have to get closer to each other.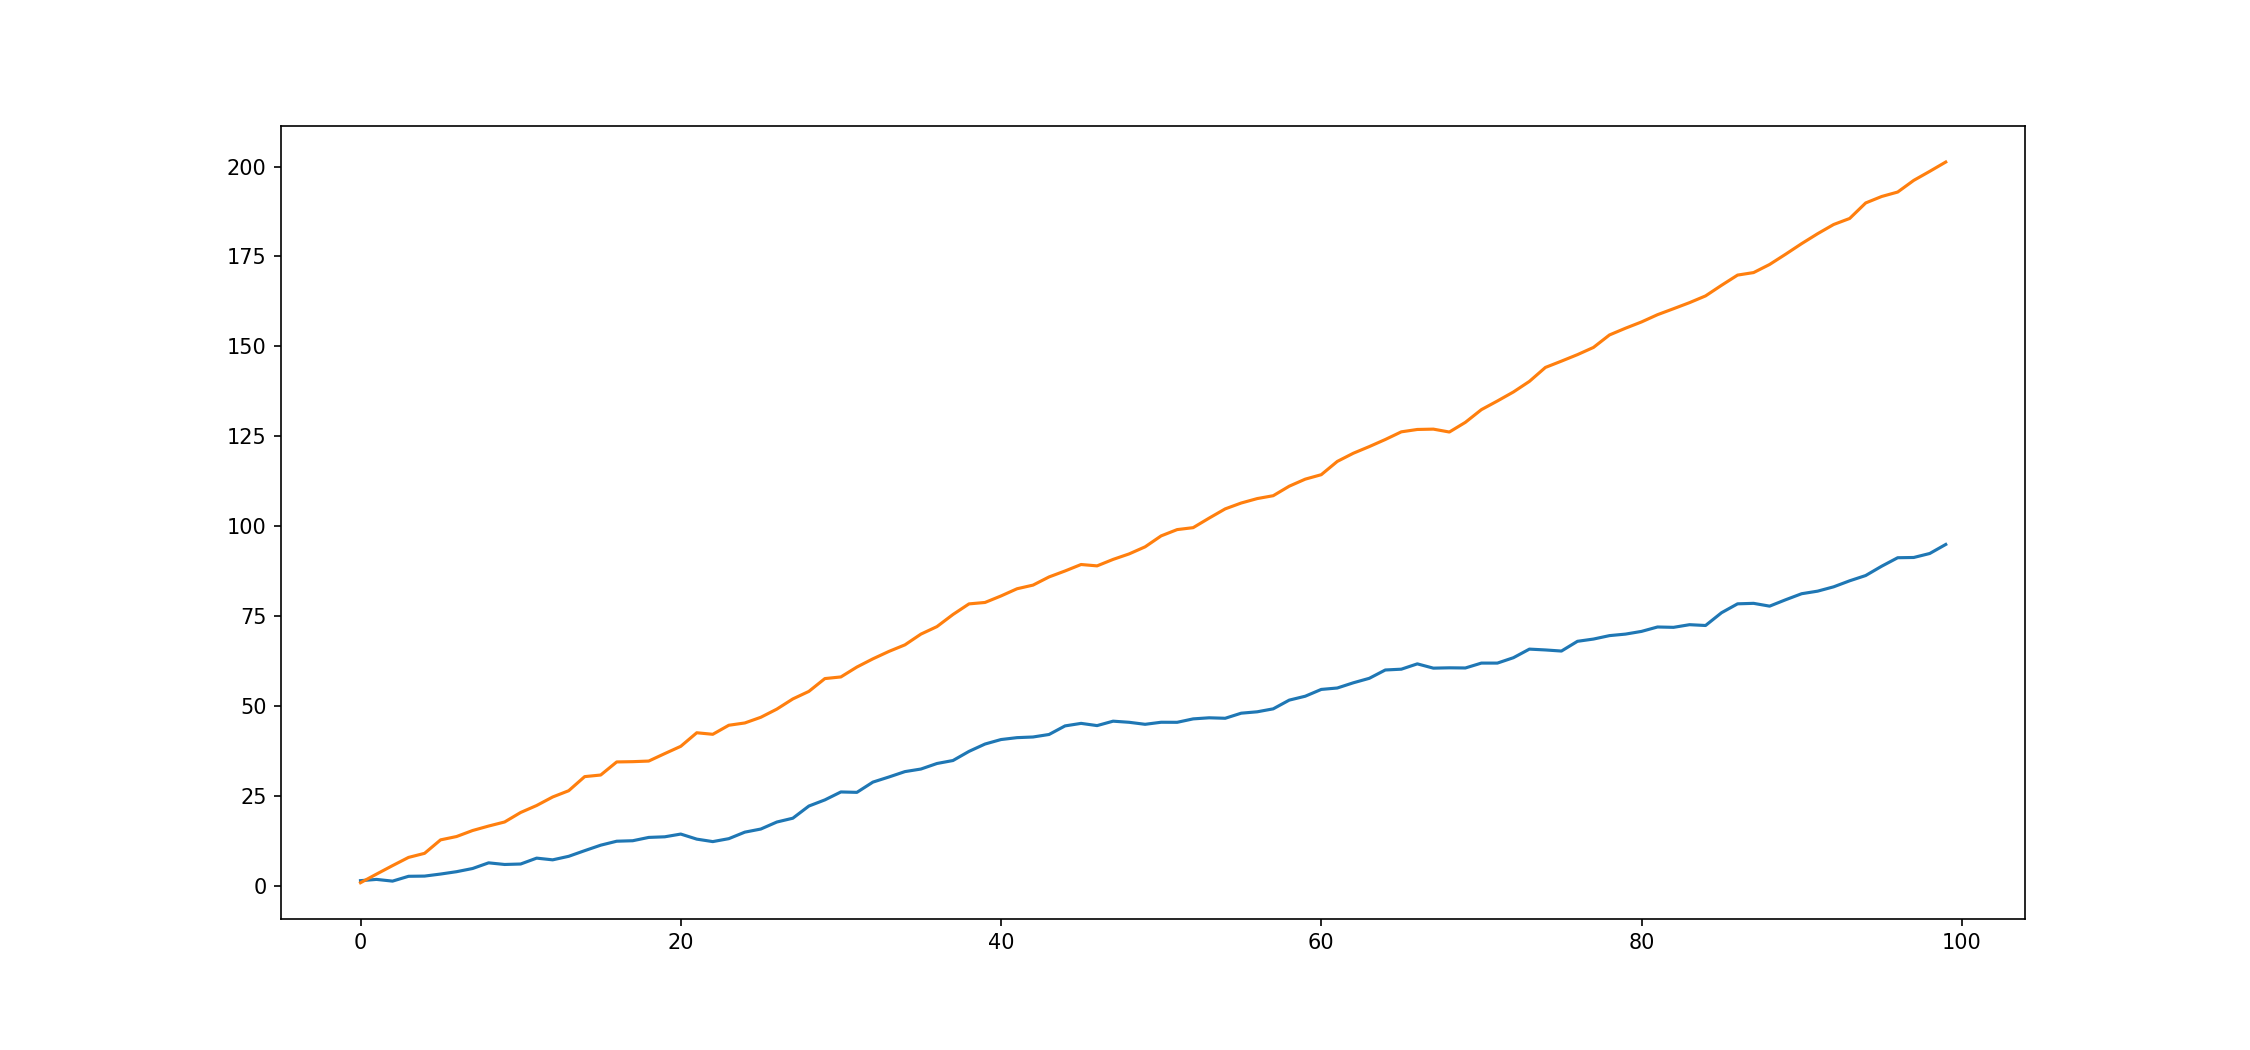 However, desirable for pair trading is a situation where the time series are driven back each other again after a temporary deviation, what is not guaranteed by the presence of a high correlation of value differences. The co-integration analysis is able to better identify this time series attraction phenomenon.
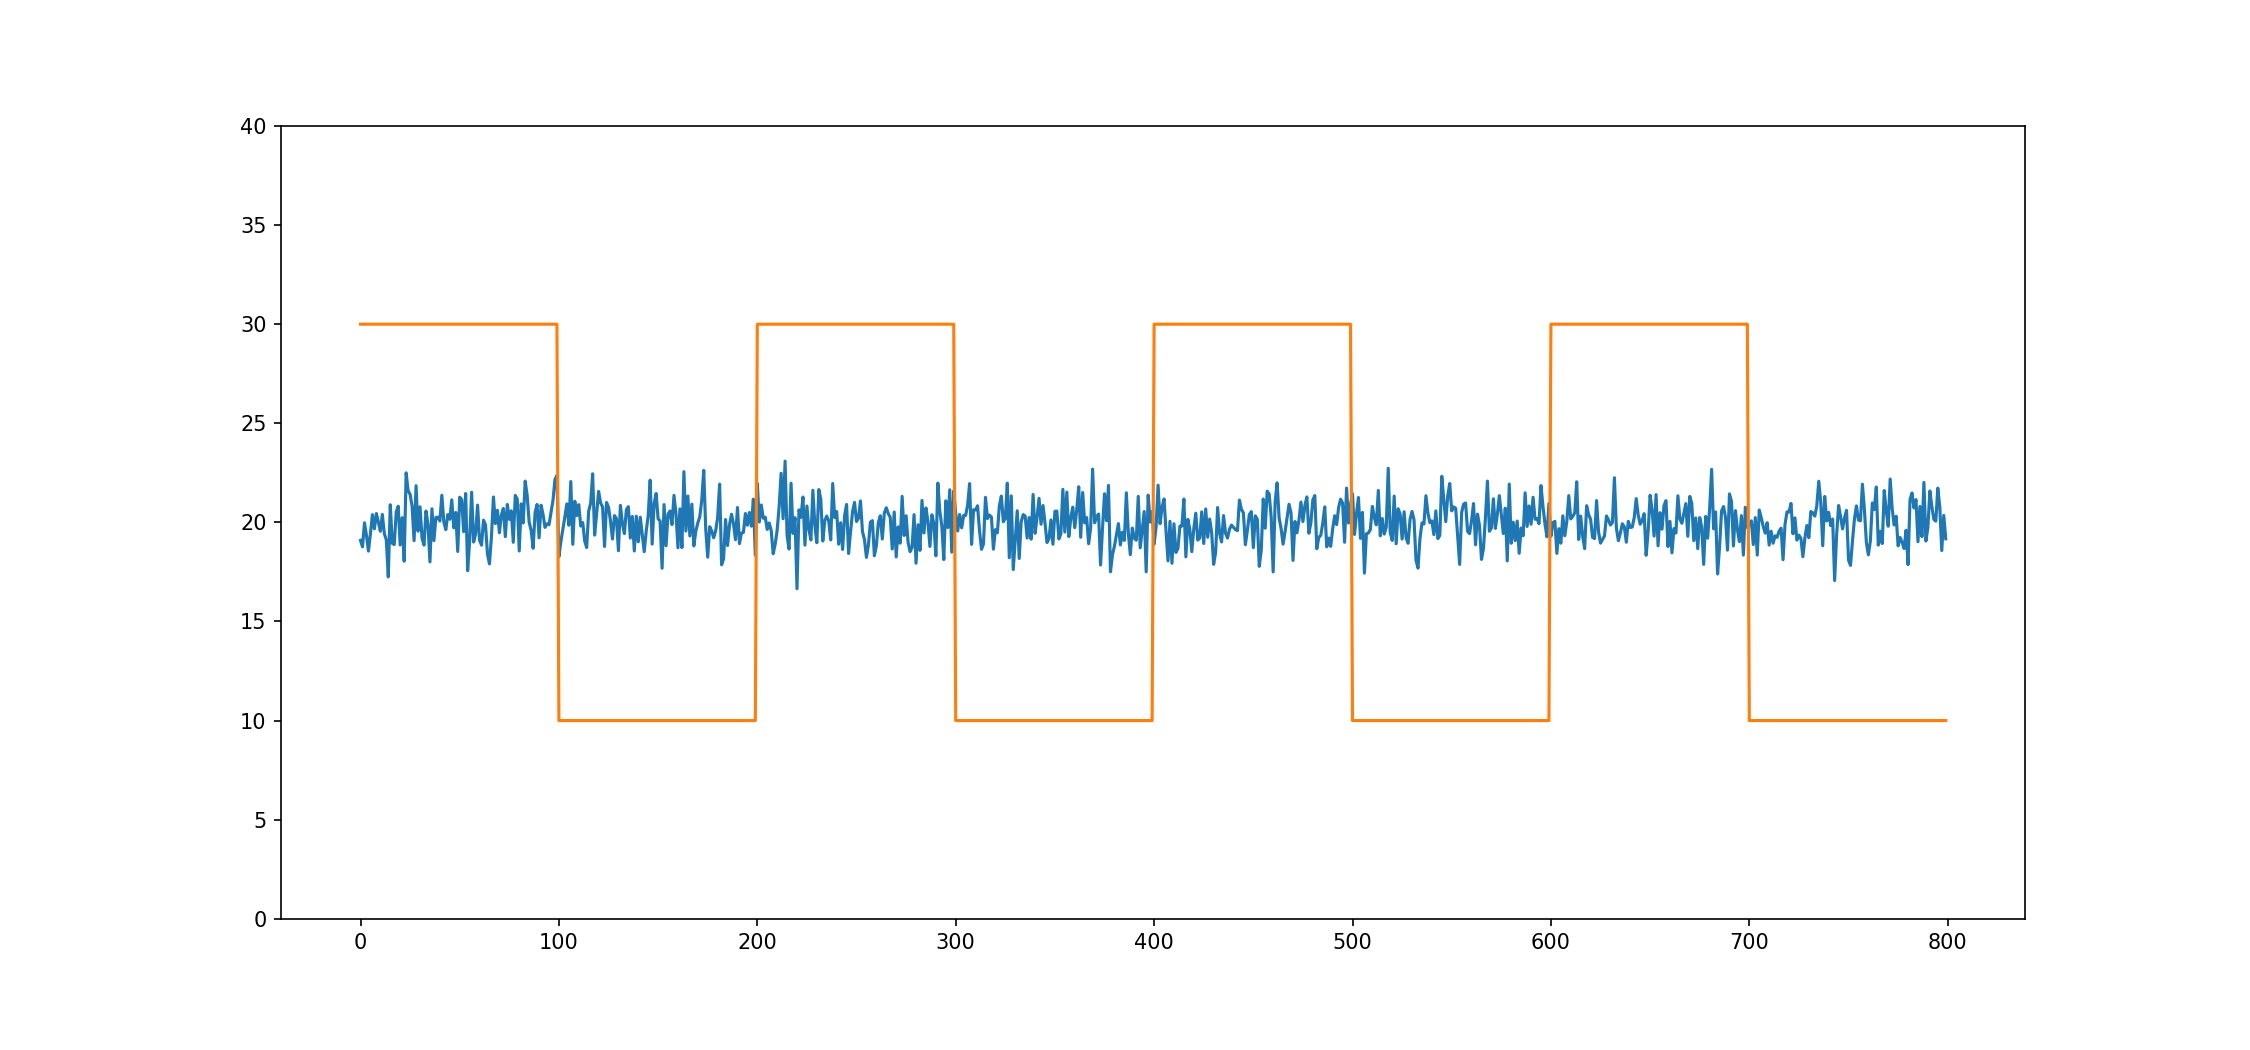 The analysis of the value differences correlation can be used as one of the initial filters for selecting candidates, among which the pairs suitable for pairs trading are then sought.
Cointegration analysis is the most common current approach used to identify pairs. It relies on the statistical concept of stationary random processes, which are non-trend processes, having the constant variance with changing time and the same course of autocorrelation function. Most financial time series do not meet these characteristics, so they are non-stationary processes, however stationarity testing can be used to find common behavior of time series.
In general, a linear combination of two non-stationary time series results again in a non-stationary time series. However, if time series are generated by the same or very similar processes, it is possible that some linear combination of these series results in a stationary series. The basic idea of co-integration analysis is thus to find a pair of non-stationary time series whose linear combination creates a stationary time series. In order to consider series to be co-integrated, residuals from the found linear combination of the series must be stationary.
For time series entering the analysis, various transformations, such as normalization, original values logarithms, or moving averages, are often used due to assumptions for certain methods using. The most known method for finding a linear combination is the so-called ordinary least squares method, the so-called total least squares method (orthogonal regression) can also be used. Many unit root tests are dealing with testing of the series (residues) stationarity, the most known representative is the ADF test, PP test or KPSS test. For better decision making, it is advisable to perform a KPSS test and one of the other tests of this type (ADF). The KPSS test differs from the others by constructing a null hypothesis (it looks for evidence for non-stationarity, while ADF and others for stationarity), if the tests agree, there is a very high probability that the conclusion is really true.
In addition to testing the stationarity of residuals from the found linear combination, it is advisable to perform a simple analysis of the frequency of the series returns to its mean value, or time between intersections respectively. The advantage of this analysis is the fact that it targets directly a particular feature of a series that is, from a practical point perspective, most important for pair trading purposes. The found pair exhibiting residual stationarity may have such a low frequency of return to its mean that it will be uninteresting for pairs trading, as it would be needed by such a pair to hold positions open for too long, which can be a problem from a risk management perspective. Thus, stationarity itself does not have such a strong meaning here, one of its manifestations is more significant rather: the high frequency of time series returns to its mean value.
However, after finding the pairs with properties close to ideal requirements (with the residuals from a linear combination that are stationary and having a high enough frequency of return to mean), it can be assumed with certainty that these relationships will not last forever. A period of 6 months is normally recommended as a suitable period for repeating the search process.
Naďa Chalupová