Feel free to write us
a message.

Model Diagnostics with Learning Curves
event_note 22.07.2021
Reviewing learning curves of models during training and plots of the measured performance can be used to diagnose problems with learning, such as an underfitting or overfitting model. Besides that, it can also be used for diagnosing whether the training and validation datasets are suitably representative and to observe generalization behavior, as well. Our team uses the learning curve visualisation to built more robust, reliable and interpretable Stock Picking Lab model.
Why (goal)
- Learning curves show changes in learning performance over time in terms of experience.
- Learning curves of model performance on the train and validation datasets can be used to diagnose if a model is underfitting, overfitting or well-fitting model.
- Learning curves of model performance can be used to diagnose whether the train or validation datasets are not relatively representative of the specific problem domain.
What (key point)
- Plot learning curves
- Diagnosing model behavior
- Diagnosing unrepresentative datasets
How (procedure)
Learning curve
A learning curve is a plot of model learning performance over experience time period on the x-axis and learning or improvement on the y-axis.
Learning curves (LCs) are deemed effective tools for monitoring the performance of workers exposed to a new task. LCs provide a mathematical representation of the learning process that takes place as task repetition occurs.
– Anzanello, M. J., & Fogliatto, F. S. (2011)
Learning curves are widely used in machine learning for algorithms that learn i.e. optimize their internal parameters incrementally over time, such as deep learning neural networks. During the training of a machine learning model, the current state of the model can be evaluated at each step of the training algorithm. It can be evaluated on the training dataset to give an idea of how well the model is “learning”. It can also be evaluated on a hold-out validation dataset that is not part of the training dataset. Then evaluation on the validation dataset gives an idea of how well the model is “generalizing”.
Training learning curve: Learning curve calculated from the training dataset gives an idea of how well the model is learning
Validation Learning Curve: Learning curve calculated from a hold-out validation dataset gives an ideal of how well the model is generalizing
It is common to create dual learning curves for a machine learning model during training on both – the training and validation datasets. Sometimes it is also common to create learning curves for multiple metrics. In the case of classification predictive modeling problems. Here the model may be optimized according to cross-entropy loss and model performance is evaluated by using classification accuracy. In this case, two plots are created, one for the learning curves of each metric, one for each of the train and validation datasets. Note that each plot can show two learning curves.
Optimization learning curves: Learning curves calculated on the metric by which the parameters of the model are being optimized, e.g. loss
Performance learning curves: Learning curves calculated on the metric by which the model will be evaluated and selected, e.g. accuracy.
Diagnosing Model Behaviour
The shape and dynamics of a learning curve can be used to diagnose the behavior of a machine learning model and in turn, perhaps suggest as the type of configuration changes. This option may be used to improve learning and/or performance.
In general, we can observe 3 types of dynamics:
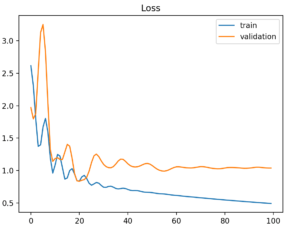
- Underfitting
- Overfitting
- Well-fitting.
Diagnosing Unrepresentative Datasets
An unrepresentative dataset means a dataset that may not capture the statistical characteristics relative to another dataset drawn from the same domain. For instance, between a train and a validation dataset. An unrepresentative training dataset means that the training dataset does not provide sufficient information to learn/understand the problem, relative to the validation dataset used to evaluate it.
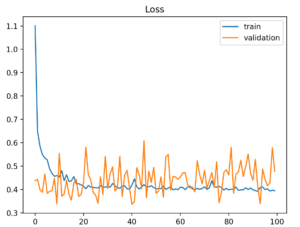
An unrepresentative validation dataset means that the validation dataset does not provide sufficient information to evaluate the ability of the model to generalize. This may occur if the validation dataset has too few examples as compared to the training dataset. This case can be identified by a learning curve for training loss that looks like a good fit (or other fits) and a learning curve for validation loss that shows noisy movements around the training loss.
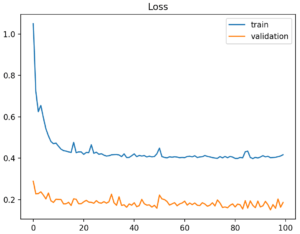
It may also be identified by a validation loss that is lower than the training loss. In this case, it indicates that the validation dataset may be easier to predict for the model than the training dataset.
To sum up
Learning curves can bring important insight during the design process of a machine learning model. Visualization of the learning process from various points of view serves to human as a strong, fast and intuitive tool for identification of strengths and weaknesses of the analysed model and for possible issues detection.
References
| [1] | Jason Brownlee. (2019, August 6). How to use Learning Curves to Diagnose Machine Learning Model Performance. Machine Learning Mastery. How to use Learning Curves to Diagnose Machine Learning Model Performance – Machine Learning Mastery |
| [2] | Anzanello, M. J., & Fogliatto, F. S. (2011). Learning curve models and applications: Literature review and research directions. International Journal of Industrial Ergonomics, 41(5), 573–583. Learning curve models and applications: Literature review and research directions |