Feel free to write us
a message.
Complexity of each calculation in the StockPicking Lab
event_note 24.08.2021
The use of machine learning in the quantitative investment field is expanding and the right usage is encouraging many to explore the world of investing. To generate market advantages and enable our users to enjoy the greatest stock selection process, we are choosing beneficial data, suitable to give us not only the Artificial-Intelligence-driven tool for making the right stock decisions but also interpretability and transparency of process and results. Our calculations include data collected for the last 30 years, allowing us to get more robust and reliable results.
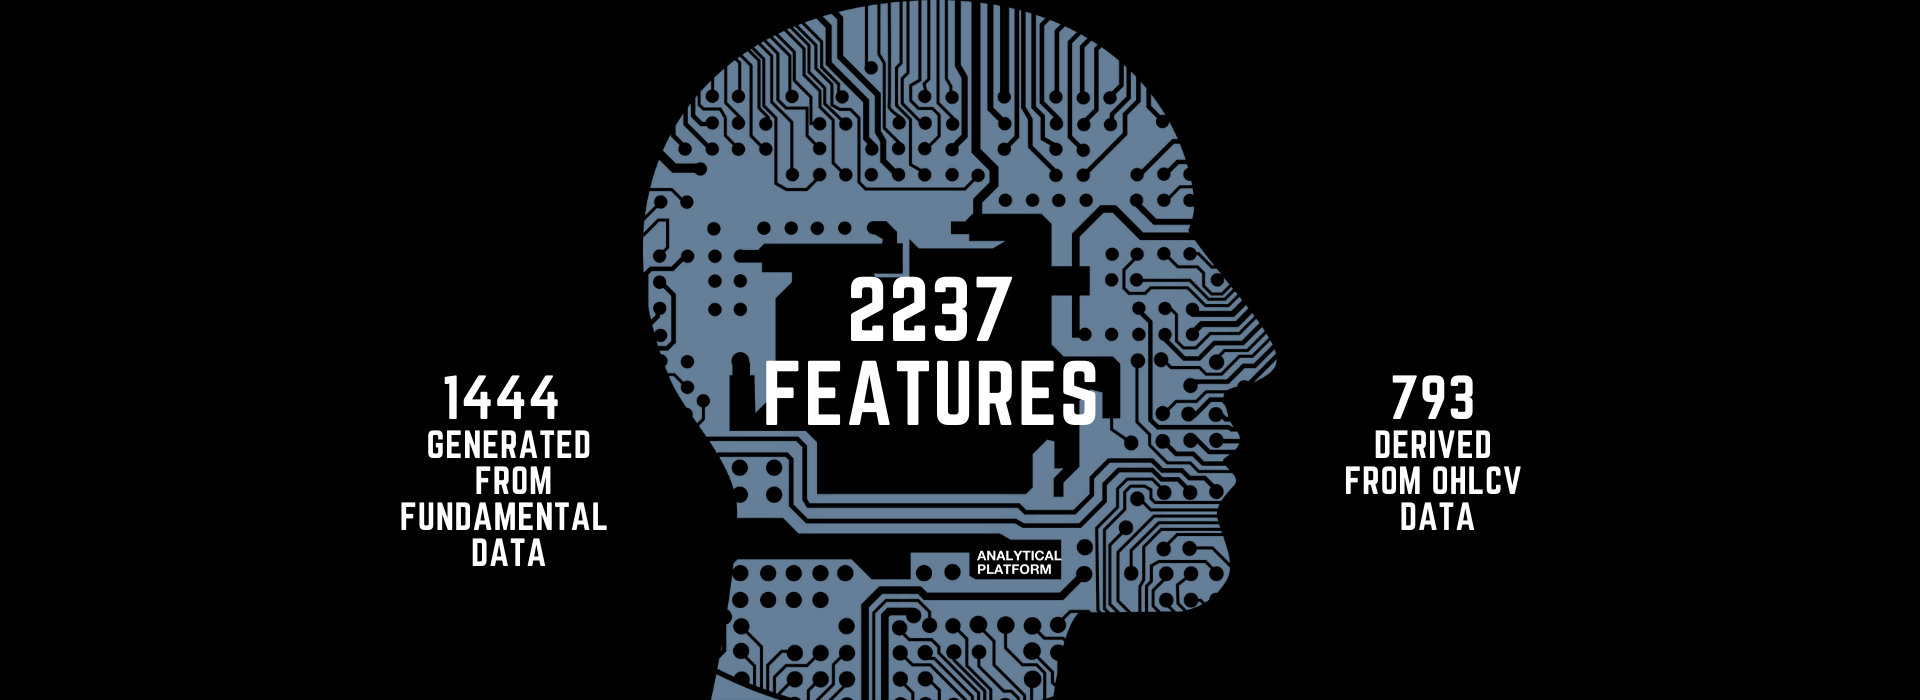
When calculating the results and preparing a list of undervalued and overvalued stocks in our StockPicking Lab, for every asset, stock, and ticker we use 2237 features. This number is intriguing when taking into consideration that the best financial analysts use approximately 100 features for their stock performance predictions. 793 from mentioned 2237 features are derived from OHLCV data (Open, High, Low, Close, and Volume). The mentioned acronym shows a list of the five most common data types used in financial analysis. For visualization of this type of data famous candlesticks-charts are used and it enables us to consider a huge number of situations in past.
The remaining 1444 features are generated from fundamental data. How exactly is this number calculated? We are using 76 basic source fundamentals, from these features we derive other features based on two ‘’positions’’ – absolute and relative and then multiply the result by nine timely horizons. This feature involves, for instance, operating cash flows of companies on the stock market and is utilitarian for indicating whether a company can generate sufficient positive cash flow to maintain and grow its operations or it may require external financing for capital expansion, which naturally influences stock prices. These features are including fundamental data itself and also indicators derived from them, such as measuring operating flow in the past 252 days (trading days per year in the US stock and option markets).
It is to be noted, that we value only total data. In case that we do not have complete data for every single stock, we are not implementing a certain feature for any of the stocks. In the future, we are definitely planning to use even more predictors to get rich data set for which performing continuous data engineering is needed.To get a clear picture of the size of data used for the calculations, we will give you a few hints: The computational memory contains 225937 columns with each rebalance. While each column has about 8500 rows. Altogether, there are around 1,920,464,500 numbers included in the dataset.
Taking that each number takes up from 4 to 8B of memory, a total of 7.5 GB is needed for only 100 stocks (S&P100). To manage this kind of task an average computer would need approximately 2 days. Moreover, scaling up your stock universe for 500 stocks (S&P 500) would take 64 GB, because the dataset explodes exponentially. In addition, it is also needed to store intermediate calculations.
To sum up, this amount of usage of data factors highly correlated to market returns is enabling us to generate more robust and reliable predictions used in our StockPicking Lab reports.