


Feel free to write us
a message.
Take a look at the first report of our results in 2021.
In January, our system, based on a portfolio of 20 relatively most undervalued* stocks from the S&P 100 index in the Long position and 20 relatively most overvalued* stocks in the Short position, achieved a 4.1 % yield. The S&P 500 index fell by 1.1 % over the same period.
The performance of the system is 39.52 % at an annual recalculation. Detailed results can be viewed here.
You can view a report with for the month of February in our StockPickingLab application, or in the application of the partner company StockPicker.eu.
Factors that influence the decision-making of the model (now for the February stock selection, the calculation took place on 31 January 2021).
Variable | Coeff | Weight |
|---|---|---|
| Constant | 0,01% | 0,03% |
| Autocorrelation 5 | 1,79% | 6,46% |
| Momentum 252 - 22 | 3,43% | 12,40% |
| USD Volume Relative Change 22 vs 44 | -1,48% | 5,35% |
| CCI 4 | -2,74% | 9,91% |
| SUV Resid 252 | 0,76% | 2,73% |
| SUV Coef 126 | -1,38% | 4,99% |
| SUV Coef 104 Weeks | -1,32% | 4,78% |
| AR LogPrice 52 Weeks | 2,49% | 9,00% |
| DividendPerShare DPS | -2,22% | 8,01% |
| EarningsPerShare EPS | 0,22% | 0,79% |
| MarketCapitalization MV | -2,83% | 10,20% |
| OperatingCashFlow OperatingCF | 0,50% | 1,81% |
| SalesPerShare SPS | -0,14% | 0,52% |
| PriceBookValueRatio PTBV Change 126 Days | -0,46% | 1,65% |
| PriceCashFlowRatio PCF Change 126 Days | -1,27% | 4,60% |
| PriceEarningsRatio PE Position 66 Days | -1,05% | 3,78% |
| PriceBookValueRatio PTBV Position 252 Days | -3,60% | 13,01% |
The Momentum Formula II system did not trade in January due to a persistent error by Interative Brokers in placing stoplosses.
*Calculation of over/ undervaluation is based on the analysis of macroperdictors and company-specific predictors, see above.
Take a look at the results of our trading systems in a real trading environment.
Since July 2019, our automatic trading system Momentum Formula, built on oil and gold, has been in full operation. You can find more information here.
Below we present the results in real operation, including the market fees:
| Trading start | 17 JULY 2019 |
| Number of trading days | 144* |
| Number of Trades | 23 (10 MGCM20.CMX, 13 QMM20.NYM) |
| Value of capital (17 JULY 2019) | 198 745,23 CZK |
| Value of capital (11 MAY 2020) | 217 955,90 CZK (219 447,23 CZK including Forex) |
| Performance | 9,7 % (10,4 %, including Forex) |
| Performance Challenge (Alfa) | Alfa (MGC/QM) = 9,7 % – ((17,5 %+(-20,2 %))/2) = 29,9 %
Alfa (S&P 500) = 9,7 % – (-1,8 %) = 11,5 % |
Benchmark: S&P100
| Benchmark Start Price | 2984,42 |
| Benchmark End Price | 2929,80 |
| Benchmark Yield to Date | -1,83 % |
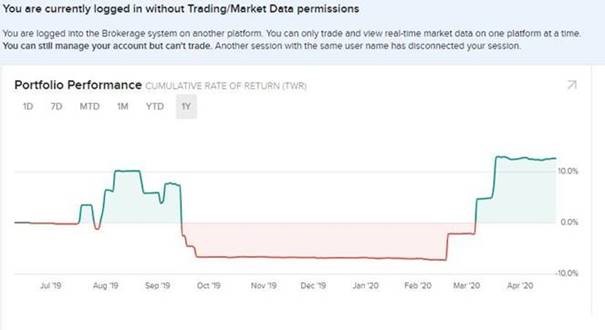
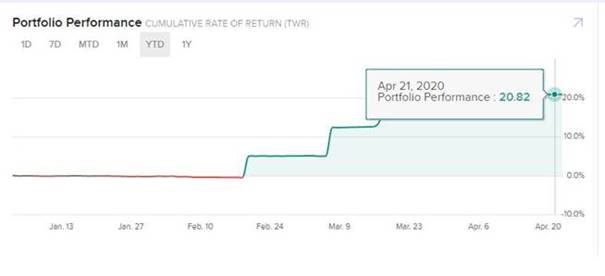
The expected profit is 20 % p.a. In September 2019, we realized a larger loss due to an error of the MKT order type. ATS placed a Market order and, due to a weekend attack in the UAE, there was no counterparty to trade at the expected price, after the market was opened. The system was subsequently shut down and an updated version was deployed in March 2020, also with a new LMT Market order.
Head of FRS Development, Michal Dufek.