Feel free to write us
a message.

Momentum Formula report 02/2019-06/2019
event_note 08.07.2019
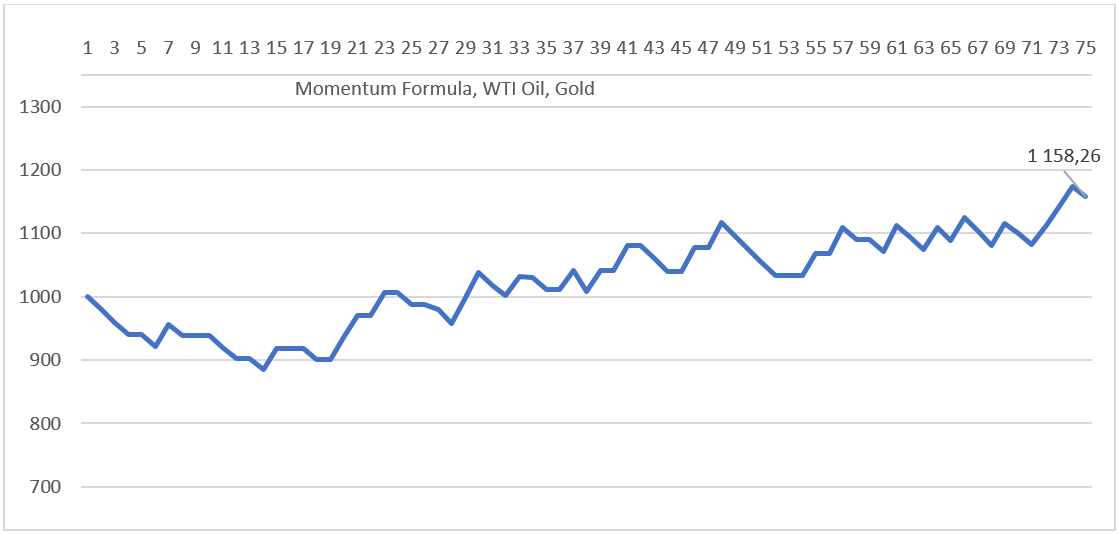
Test run of our automatic oil and gold based Momentum Formula trading system has been running since February. This paper presents the results of the system.
| Test start | 15/2/2019 |
| Number of test days | 138 (2/7/2019) |
| Number of trades | 74 |
| Value of capital 15/2/2019 | 1 000 USD |
| Value of capital 2/7/2019 | 1 158 USD |
| Profit (YTD) | 15.8 % |
| Risk (Maximum Drop) | 11.42 % |
| Profit per annum | 47 % |
| SharpeRatio (number of profit units per risk unit) | 2.18 |
Orders are executed through Interactive Brokers.
The results are displayed including errors that have occurred during the testing period (for example, the system crashed over the weekend).
We have further improved the system during the reporting period. We’ve eliminated infrastructure bugs, and we’ve enriched the model with new information to eliminate sinks. Below you can see the slumps achieved by the reported strategy (blue curve) and the slump in the improved version that we will soon deploy (orange curve).
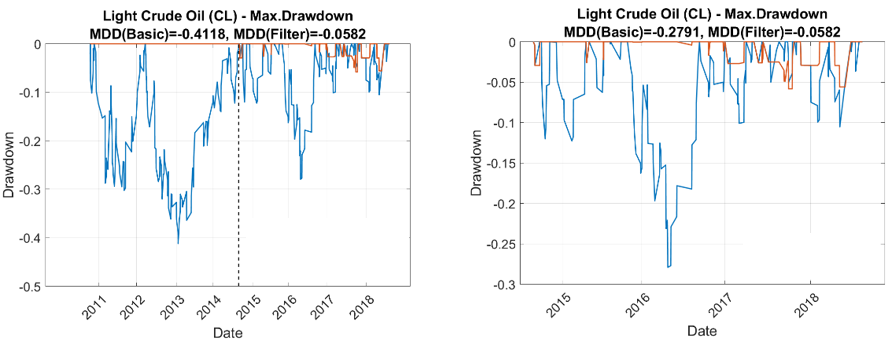
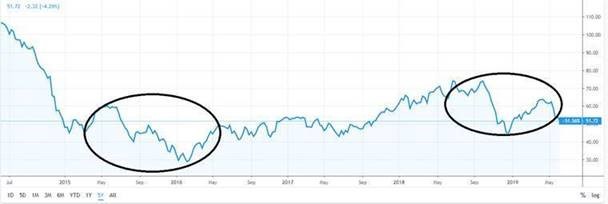
The risk level of this system in the case of oil is about 5% (the strategy had the largest value of the property dicrease about 5%). The underlying asset (crude oil) for the reporting period (2015 – end 2018) shows a maximum fall of around 50% (decline episode June 2015 – February 2016, followed by September 2018 – December 2018).
Head of FRS Development, Michal Dufek