


Feel free to write us
a message.
In today’s post, we are returning to the Relative Value Approach topic, where we have put a methodology for analyzing stocks, in particular stock couples that show co-movement. We will use this co-movement to create a market-neutral trading strategy (in this case pair trading).
In the last post we introduced the part of the application that searches in the given stock titles and selects those whose logarithmic price differences are mutually correlated. However, this result is static, valid for the moment we run the application. The user will also be interested in the stability of these pairs (or their correlation) over time. Therefore, the application is extended by a walk forward test, which is testing the development of correlated pairs over time.
Methodology
A non-anchored test is performed within the walk forward test. The beginning and the end are scrolling, ie the test window is not extended. As in the previous case, batching is calculated by linear correlation of logarithmic price differences.
Computation
For each pair of in / out-sample correlation thresholds, a walk-forward test was performed:
- Each walk forward test is a set of partial tests for different walk-window lengths (walk-windows ranging from 2 years to 20 years with a 1 year step)·
- Each walk-window has a different length of in / out-sample (1 – 20 years, with 1 year step)·
- The start of in-sample section has been shifted from the beginning of the data by the length of the out-sample section (eg, the 5-year test starts from 1997 to 2013, ie the end of 2018)·
- The “survival” of the pairs in each walk-window was monitored, ie the number and / the proportion of those in-sample pairs that were also identified in the out-sample section·
- For example, 80% means that 10 pairs were found in the in-sample, in out-sample were found 8 of these pairs.
Results
The heatmap summarizes the walk-forward test results for a pair of correlation thresholds (in-samle and out-of-sample data). Each stripe of numbers parallel to the main diagonal in the figure represents the results of a set of tests for a certain walk-window length (the sum of the numbers on X and Y is the window length).
The individual boxes show the results for each combination of in-sample and out-sample window lengths. The horizontal axis (X) shows the in-sample window lengths, the vertical (Y) out-sample windows. E.g. the values for the 5-year window test are the points with coordinates (X, Y): (1, 4), (2, 3), (3, 2), (4, 1). Missing fields below the main (or secondary – see above) diagonal mean that no pair in walk-window in the in-sample was found in any of tests. The shorter the walk-windows, the more times they can move over the full length of the data, ie the more partial tests take place, and thus the resulting aggregate value (average, median, etc.) is more robust.
The more favorable (desirable) results are darker, unfavorable lighter, each metric has its “color” (average – blue, median – green, test properties – red, range – purple).
Mean
In the first image, in the area of narrowing “1” line near the main diagonal, the survival of couples are extremely negative (0 or crossed out) as well as positive (100%). The area copied the narrowing line of “1” in the number of tests performed (the first red chart), ie the tests performed only once (due to long out-sample / sliding windows). The “XOM-CVX” pair is almost always the result, so it’s the strongest pair across different seasons.


Median
The figure below shows similar results as in the previous case, only the “survival rate with the highest frequency” is calculated instead of “average survival rate”. In other words, the average is replaced by median.

Conclusion
The output of this application function is robustness testing, or better stability of pairs over time. Let’s take an example when a user of the application selects to date a list of couples which are suitable for pair trading.
Then the user thinks about the list and thinks about how the list would change if the export was done yesterday or a year ago … The answer is just a walk forward test that tracks and evaluates changes in the list of pairs over time. By using this feature, the user recognize that XOM-CVX (Exxon Mobil Corporation and Chevron Corporation) is one of the pairs with the strongest interrelationship between the analyzed assets.
Besides research-related and data analysis activities, our team also deals with automation and simplification of analytical processes. In today’s post, we would like to introduce the first type of report – quarterly earnings announcement and its analysis.
The report follows the impact of the announced Earnings (with the quarterly period) on the price on the selected assets. Let’s take Deutsche Boerse AG as an example. An investment analyst or a portfolio manager responsible for the decision-making process shall receive the necessary information:
- Earnings Announcement date
- Earnings Announcement time
- Comparable Earnings per Share (EPS)
- Earnings per Share (EPS) current quarter
- Earnings per Share (EPS) estimated value
The report below gives the analyst as an insight into how strongly and in what direction the market has reacted to the reported results. The sentiment of movements, of course, determines the ratio between the estimated EPS value and the announced value. If the current value is higher than estimated, it’s a „positive information“ and if the current values are lower than expected it’s „negative information“.
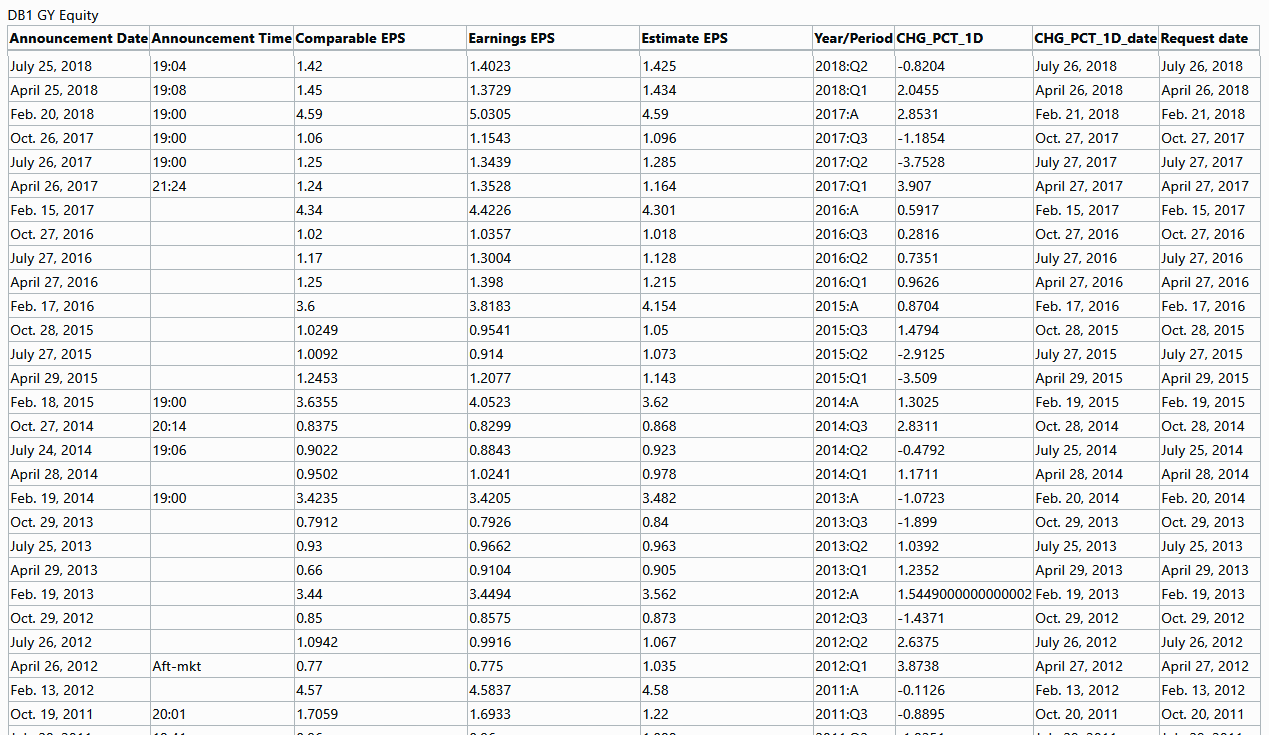
The practical use consists of a given overview of how the markets have absorbed information about the published results of the analyzed assets in recent quarters. Next a balance of positive and negative deviations in real values from those brings useful information, indicating whether the expected results are systematically underestimated, in line with the announced results or overestimated.
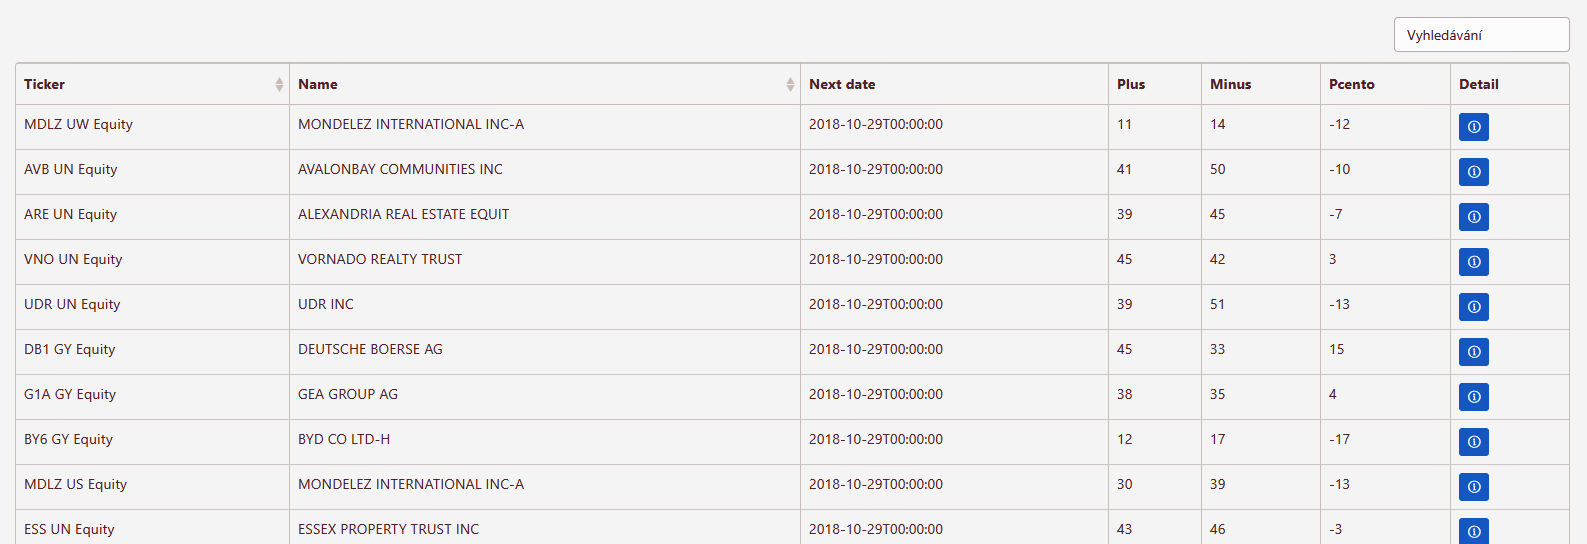
The report can be used by investments analysts or portfolio managers to receive a quick overview of how the analyzed assets reacted to the Earnings Announcement of the results in past quarters, thus, for example, obtaining information on whether the expected results in the summary are overestimated or undervalued.