


Feel free to write us
a message.
Take a look at the first report of our results in 2021.
In January, our system, based on a portfolio of 20 relatively most undervalued* stocks from the S&P 100 index in the Long position and 20 relatively most overvalued* stocks in the Short position, achieved a 4.1 % yield. The S&P 500 index fell by 1.1 % over the same period.
The performance of the system is 39.52 % at an annual recalculation. Detailed results can be viewed here.
You can view a report with for the month of February in our StockPickingLab application, or in the application of the partner company StockPicker.eu.
Factors that influence the decision-making of the model (now for the February stock selection, the calculation took place on 31 January 2021).
Variable | Coeff | Weight |
|---|---|---|
| Constant | 0,01% | 0,03% |
| Autocorrelation 5 | 1,79% | 6,46% |
| Momentum 252 - 22 | 3,43% | 12,40% |
| USD Volume Relative Change 22 vs 44 | -1,48% | 5,35% |
| CCI 4 | -2,74% | 9,91% |
| SUV Resid 252 | 0,76% | 2,73% |
| SUV Coef 126 | -1,38% | 4,99% |
| SUV Coef 104 Weeks | -1,32% | 4,78% |
| AR LogPrice 52 Weeks | 2,49% | 9,00% |
| DividendPerShare DPS | -2,22% | 8,01% |
| EarningsPerShare EPS | 0,22% | 0,79% |
| MarketCapitalization MV | -2,83% | 10,20% |
| OperatingCashFlow OperatingCF | 0,50% | 1,81% |
| SalesPerShare SPS | -0,14% | 0,52% |
| PriceBookValueRatio PTBV Change 126 Days | -0,46% | 1,65% |
| PriceCashFlowRatio PCF Change 126 Days | -1,27% | 4,60% |
| PriceEarningsRatio PE Position 66 Days | -1,05% | 3,78% |
| PriceBookValueRatio PTBV Position 252 Days | -3,60% | 13,01% |
The Momentum Formula II system did not trade in January due to a persistent error by Interative Brokers in placing stoplosses.
*Calculation of over/ undervaluation is based on the analysis of macroperdictors and company-specific predictors, see above.
Take a look at the results of our trading systems in a real trading environment.
We are launching the StockPickingLab section, through which you gain access to the relatively most undervalued and overvalued stocks within the S&P 100 index.
- You can view the results of the Stock Picker system in real operation here. The average annual yield is 17,69 %, while the maximum drawdown is -13,72 %.
- Factors that influence the decision-making of the model are listed in the previous article.
- Detailed information and access to the system are under this article.
We provide an analytical report as the output of the developed software for analysts in the capital markets. This is by no means an investment recommendation. We do not provide any financial services. Our activity is the development of software based on AI methods. We are developing the model in cooperation with Mendel University in Brno and the University of Economics in Prague. For more information or cooperation with our company, do not hesitate to contact us.
Take a look at the results of our trading systems in a real trading environment.
We would like to inform you about the change of the name and headquarters of our company.
From the original CYRRUS ADVISORY, a.s. with its registered office at Veveří 111, 616 00 Brno, we change to CCF RESEARCH, a.s. with its registered office at Jana Babáka 11, 612 00 Brno. The decisive date is 20. 10. 2020.
The ID number, shareholder structure and other facts do not change in any way.
We believe that the new name will contribute to further development and independence in the field of research and development of software for trading on the capital markets. In the coming days, there will be adjustments to the website and all contractual documentation. Thank you for your understanding, with the possible short-term publication of two names.
We would like to introduce the PatternLab application, the module of AnalyticalPlatform.com. Current version offers testing of 66 price patterns on 3000 stock titles.
- The application brings detailed performance and risk statistics about the pattern behaviour.
- If deciding to trade according to the tested pattern, the application also provides email notifications.
- All these services are provided free of charge. Additional paid service is pattern testing with the inclusion of market/broker fees.inclusion.
User Guide
Who is the PatternLab module for?
The module is for active traders using technical analysis and patterns recognition as entry/exit rules for their trades.
What is a “pattern”?
A pattern is a candlestick formation, usually consisting of 2 to 6 candlesticks. This formation has got precise rules which has to suit to be established as a specific pattern. Generally said, the pattern is a formation regularly and periodically appearing in asset price development through time. From another point of view a pattern can be considered as a “mistake” or an inefficiency in the price development. A price development is considered as a random (stochastic) process and a pattern occurrence disrupts this randomness. One candlestick represents the time period such as day, week or month.
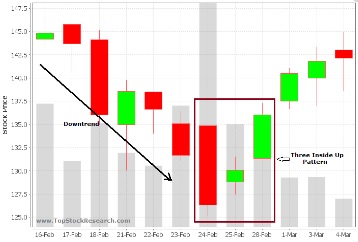
Where can I find the list of the available patterns?
There is a list of available patterns in the “Patterns Recognition” section. Feel free to google random patterns to gain their intuition.
How can I use patterns for my trading?
The patterns are believed to be an entry or an exit signal for opening/closing position. It means that in the time the pattern occurs it is a signal for traders to open or close their position.
How can I exploit the PatternLab application?
The PL app is the tool for testing and verifying included patterns. The PL’s database includes 66 price patterns and 3000 assets (stocks at the moment) which can be tested for their predictability power. In general the more the pattern successful is the more the specific market is inefficient (and the specific pattern has got more predictability power). The PL application brings you detailed performance and risk statistics about the pattern behaviour. The patterns with a good predictability power (with good statistics) can be followed and you can be informed via notifications or emails about the occurence in the market. Using PatternLab application you can follow hundred of global financial assets and find some of 66 pre-defined patterns at daily, weekly or monthly candlestick formations.
Is there any rigorous proof why it could work?
The efficient market hypothesis is the answer. There are 3 types of market efficiency: strong, semi-strong and weak market efficiency. For the strong form of efficiency is believed that markets accommodate each public information and a price development performs jumps (without trends). The price development following the jumps is completely random (it is called diffusion). In practise, the strong market efficiency is very often disrupted through time and then trends and their persistency occur in the markets. Moreover, there can be a specific behavior of specific market participants which can cause “regular” and “periodical” market behaviour. E.g. large mutual fund rebalancing its EUROSTOXX50 portfolio every first monday in the month can cause “regular” and “periodical” market movements in those assets (This is only hypothetical case, not specific true story or advice). These “regular” and “periodical” market movements are basically the patterns.
How can I start?
You can use the video to get started.
- Choose a period (FROM the date and To the date) you wish to find patterns.
- Select stock(s) you would like to test.
- Select pattern(s).
- Click on “Add chart” button.
- Surf onto “BACKTEST-PATTERNS” card. (Now, you can see your preferences on the upper side of the site.)
- Set up the initial capital (your virtual amount of money).
- Choose the “Direction” option: both long & short, long only, short only.
- Set up your “Risk” per one trade.
- Set up you profit target and stop loss.
- Click on “Add patterns” button.
- Click on “Run strategies” button.
- On the right side you can surf through cards containing backtests results. The most interesting information are located in the “Performance metrics” card, e.g. Sharpe ratio is the first indicator you should take care about.
- The test and its set up you are satisfied with, you can save using “Save” button.
- Set up your notifications for desired patterns occurrences at desired assets. You can do that via “Alerts” card. Since now you receive email/notification every time the selected patterns appear.
How many assets I can scan?
The current stock universe includes 3000 stocks from Russell 3000 index.