


Feel free to write us
a message.
The article from Události EXTRA
This article is only available in Czech version.
We will look at mathematical foundations of propability theory and how deep our team has to dive into this theory to manage its optimizing solutions.
Random number generators
Random number generator is the base part of many optimization and or computational algorithms. Be it Monte Carlo methods, genetic, evolution based algorithms or initialization of weights in deep neural networks. There are still many unknowns about how to use them. And general human intuition falls short.
Ideal random number generator has uniform distribution of produced values and there is absolutely no relationship between them.
Types
Truly random generators
Truly random events are all around us on the low level – we call it noise.
Atmospheric noise is radio noise caused by natural atmospheric processes – everybody can experience it when tuning a radio to a frequency where no radio station transmit. Others are thermal, electromagnetic and quantum events – cosmic background radiation, radioactive decay or as simple as noise generated by various events on semiconductor’s PN junction.

White noise
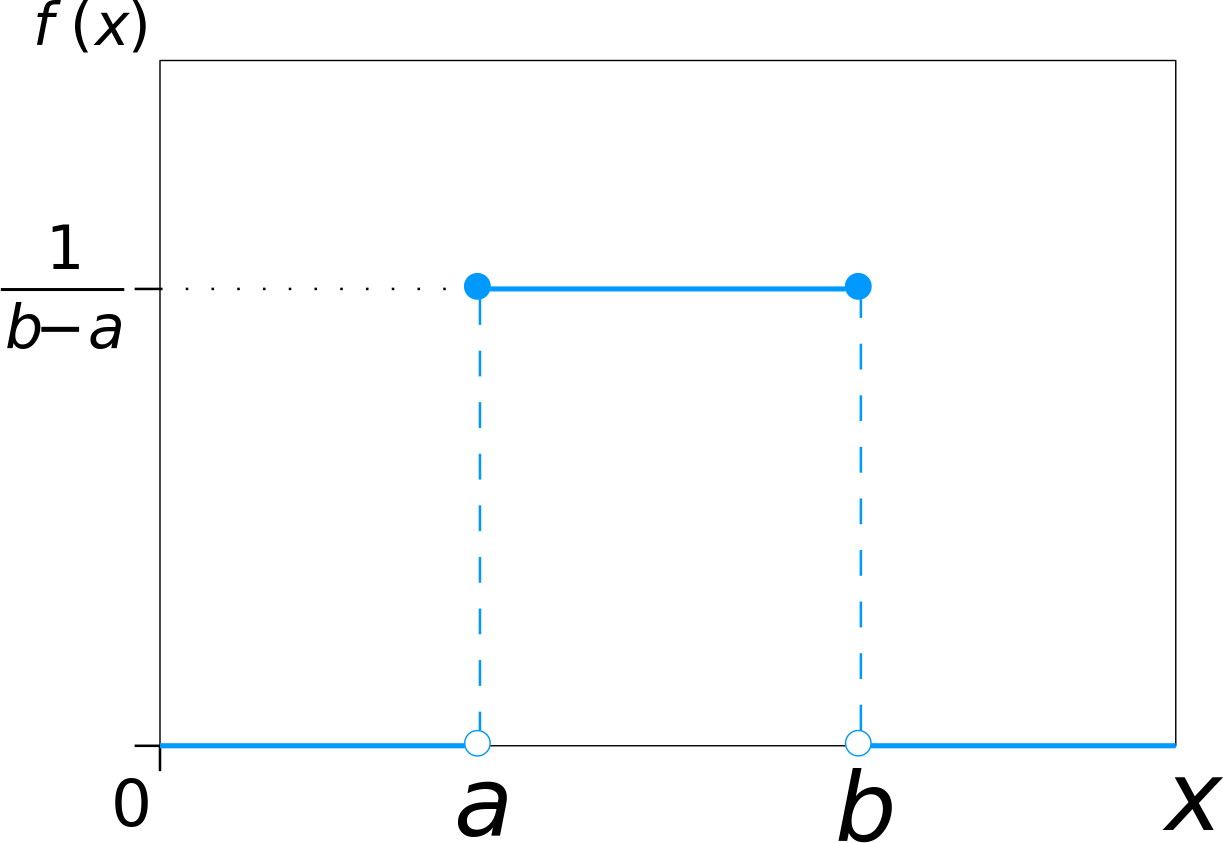
White noise distribution
Pseudo random generators
In computing we are trying to eliminate noise as much as possible. Computers are very exact and precise – exactly opposite to what we need with randomness.
To get something random from them requires collection of random events from their surroundings or a specific hardware with truly random generator.
Examples of events produced around computers are time (very limited use), delays between keyboard’s key presses, precise mouse movements, delays between packets on the network interfaces etc. The bigger the collection of these events creates better entropy for pseudo random generator initialization “vector” or “seed”.
In other words more time the computer is running the higher entropy for a pseudo random generator.
In programming
There are many ways how to initialize a random number generator with the first seed/vector. But when we are developing a program it’s essential to be able to compare program runs between each other. It’s useful to set random number generator to the same seed so the run of the program produce the same results.
Random intuition
Human world is driven mostly by Normal distribution processes.
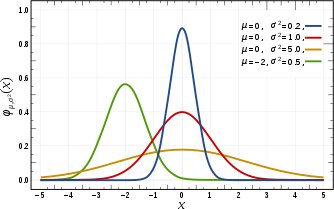
Normal distribution
Normal distribution has very low probability of extreme events. Usually in the finance standard deviation of 2 and higher is often considered as an extreme event. In other literature it is strongly advised not to use Normal distribution and it’s connected standard deviation. As it was documented the finance market might be driven by Poisson or other processes with much higher tails.
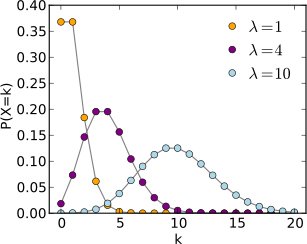
Poisson distribution
Human intuitions expects Normal distribution and definitely nothing like flat distribution of the white noise.
Randomness with evolution based algorithms
In finance and or trading the simple evidence is the genetic algorithm being able to find bugs in the backtesting process. If there is a bug allowing to look into the future… it usually takes just tens of generations to find out and exploit this bug.
Human intuition would expect the algorithm not to be able to find such edge case. Our experiences dictate, it’s able to find it each and every time.
At the same time human optimized approach to data generation and caching falls short. Of course the genetic algorithm from its definition is going to explore all of the types of data available to search for the solution probabilistically in the whole multidimensional space. Without any slim tails at the border of the space…
Missing entropy is the main cause of low robustness of financial models and trading systems. Respect for its valuation is going to increase robustness and validation od our optimizing solutions.
Milon Krejca
We have finalised the design of our application which aims at end users who are looking for generalised opinion discussed in reviews related to a particular product. Whilst standing at a product shelf in a shop, you will not have to read through dozens of reviews on price comparison websites.
Preview of the graphic design


Previous article about our software
We have downloaded over 1 million reviews
If you are interested in more information stay tuned to our website or get in touch!
One of the previous contributions “RelativeValues Lab principles” dealt with a brief description of the partial problems that software for creating trading strategy based on Relative Value approach should allow to solve. A key step in such a strategy is the identification of pairs of sufficiently similar assets. This is a very unspecified concept and therefore this step can be implemented in different ways. In order to have the searched pairs as stable as possible, it makes sense first to filter out the assets that are unsuitable for pair trading because they have very little in common (technically, economically, politically, etc.) despite their temporary (random) behavior can be similar. Initial selection can be done through various easily available indicators (descriptive and fundamental, but technical indicators can be used for these purposes too). … Among the pre-selected candidates, the pairs of those who have historically moved as much as possible together are being sought.
Several procedures based on different mathematical and statistical methods can be used for co-movements testing of time series pairs:
- value differences correlation – one of the historically first methods for the detection of potential couples, which has already been briefly presented in one of the previous contributions (The Relative Value Approach) and a more detailed summary of its outputs analysis was posted by another contribution (Walk forward test of correlated pairs)
- distance minimization – co-movement is sought as the lowest sum of squared differences between normalized series
- co-integration analysis – one series in a pair is a linear combination of the second series
- stochastic spread analysis – it assumes that the price spread oscillates around the long-term average
The output of the analysis of correlation between the time series values differences tells about the strength of the common movement match, so that series with a high correlation of value differences can move away from each other (eg. both grow, while one grows faster) and no longer have to get closer to each other.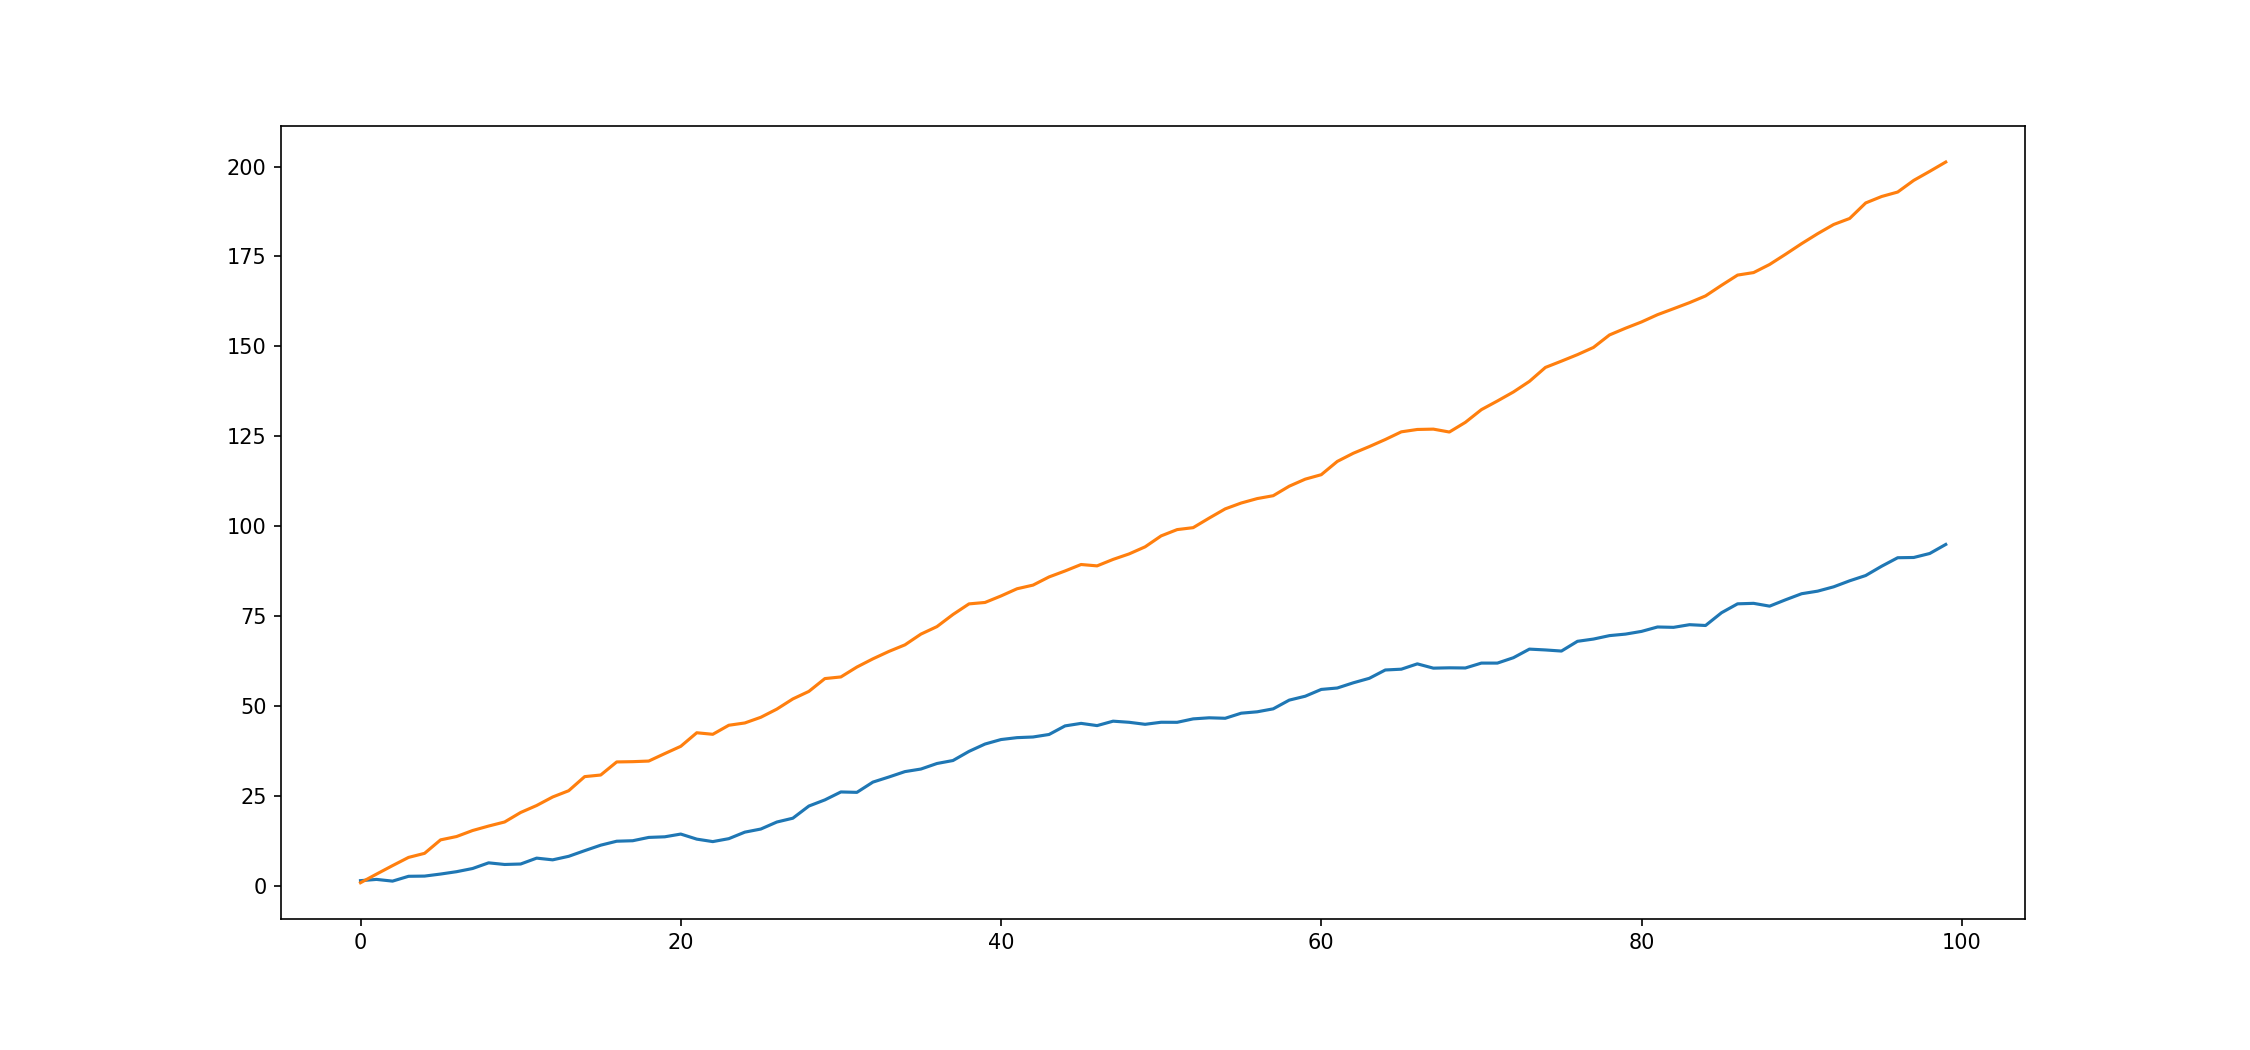 However, desirable for pair trading is a situation where the time series are driven back each other again after a temporary deviation, what is not guaranteed by the presence of a high correlation of value differences. The co-integration analysis is able to better identify this time series attraction phenomenon.
 The analysis of the value differences correlation can be used as one of the initial filters for selecting candidates, among which the pairs suitable for pairs trading are then sought.
Cointegration analysis is the most common current approach used to identify pairs. It relies on the statistical concept of stationary random processes, which are non-trend processes, having the constant variance with changing time and the same course of autocorrelation function. Most financial time series do not meet these characteristics, so they are non-stationary processes, however stationarity testing can be used to find common behavior of time series.
In general, a linear combination of two non-stationary time series results again in a non-stationary time series. However, if time series are generated by the same or very similar processes, it is possible that some linear combination of these series results in a stationary series. The basic idea of co-integration analysis is thus to find a pair of non-stationary time series whose linear combination creates a stationary time series. In order to consider series to be co-integrated, residuals from the found linear combination of the series must be stationary.
For time series entering the analysis, various transformations, such as normalization, original values logarithms, or moving averages, are often used due to assumptions for certain methods using. The most known method for finding a linear combination is the so-called ordinary least squares method, the so-called total least squares method (orthogonal regression) can also be used. Many unit root tests are dealing with testing of the series (residues) stationarity, the most known representative is the ADF test, PP test or KPSS test. For better decision making, it is advisable to perform a KPSS test and one of the other tests of this type (ADF). The KPSS test differs from the others by constructing a null hypothesis (it looks for evidence for non-stationarity, while ADF and others for stationarity), if the tests agree, there is a very high probability that the conclusion is really true.
In addition to testing the stationarity of residuals from the found linear combination, it is advisable to perform a simple analysis of the frequency of the series returns to its mean value, or time between intersections respectively. The advantage of this analysis is the fact that it targets directly a particular feature of a series that is, from a practical point perspective, most important for pair trading purposes. The found pair exhibiting residual stationarity may have such a low frequency of return to its mean that it will be uninteresting for pairs trading, as it would be needed by such a pair to hold positions open for too long, which can be a problem from a risk management perspective. Thus, stationarity itself does not have such a strong meaning here, one of its manifestations is more significant rather: the high frequency of time series returns to its mean value.
However, after finding the pairs with properties close to ideal requirements (with the residuals from a linear combination that are stationary and having a high enough frequency of return to mean), it can be assumed with certainty that these relationships will not last forever. A period of 6 months is normally recommended as a suitable period for repeating the search process.
Naďa Chalupová
Financial markets are well known for their regular behavioral change in terms of volatility, trend changes, or stagnation, due to a large number of qualitative and quantitative inputs that can’t be easily identified. However we can find patterns in price movement for some assets, and with some probability to predict future price moves and use this information to support investment decision-making (opening or closing a trading position).
The analysis of the price patterns of financial instruments can be divided into three basic categories:
- analysis of historical price (price patterns)
- analysis of fundamental information (earnings, news, economic indicators)
- analysis of crowd psychology (game theory, crowd behavior)
These three categories are interconnected and complementary. Historical price trends include a footprint of the crowd’s psychology and fundamental information.
Our team is currently working on the PatternLab tool, which can automate search and statistically evaluate patterns (price, fundamental, crowd). Using a simple form, the user selects the required pattern and asset list for analysis. Patterns are divided into several categories – an indication of volatility, a continuation of the current trend, or trend reversal.
PatternLab user
PatternLab user is the one who needs to use hard statistical data on a regular basis in investment decision making and not only relies on its intuitive decision-making. A typical example is a portfolio manager who manages the trading positions of hundreds of clients, and his decision can have a big impact on managed accounts and his credibility related to new capital acquisitions.
Use case
The portfolio manager is in a situation where he decides after 10 months to close a trading position on the selected asset. He will use PatternLab for analysis and get a statistical evaluation that if he doesn’t close the trading position immediately, but will wait for next 5 trading days, he will make extra two percent.
PatternLab may, of course, be used by retail traders, brokers or marketing department for easier communication with clients while acquiring or communicating the current status of trading positions.
Uniqueness
The uniqueness of PatternLab lies in the expert know-how of behavioral patterns that are the result of a ten-year application in the investment decision-making process. This is not about the over-optimized output of Artificial Intelligence tools but verified expert knowledge combined with regular statistical analysis.
Jan Budík
In today’s post, we are going to look at how the research application’s outputs become a custom application.
The application is planned to be divided into individual modules for each trading approach. Each module will have formalized output defined by given trading strategy: backtest and detailed analysis (with charts and metrics). The user can create own strategy by chosen input parameters.
One of mentioned trading approaches is Relative value, what is based on bets on convergence when the discrepancy between similar or same stocks widens. It means searching for opportunity to exploit from gaps in the price or rate of the same or similar securities. It supposes that the differences are only short-term and the rate of the prices will revert back to original (normal) ratio soon. Relative value funds are perceived as hedge funds as they do not trade the price of a specific security alone and the policy of benefitting from the pricing discrepancies is to buy one security (considered undervalued) and sell the other (considered overvalued) in a form of pairs trading.
The user (fund manager) will build this kind of trading strategy in some basic steps:
- selection of suitable pairs
- identification of situations leading to do trading actions
According to this universal framework, a lot of questions will rise and the application should allow the fund manager to solve them.
No doubt that the phase of suitable pairs selection is crucial. Potential fund manager has to find two stocks that are similar enough. In the data preparation step of the analysis it is necessary to solve problems like:
- what historical period to consider for pairs selection
- what indicators (technical, fundamental etc.) and what role will they play in the similarity detection, e.g. find assets what have moved together historically
- determine what to consider as normal differences (the similarity)
- what to do with pairs where the assets are too similar (nearly the same) in considered indicators (it will probably generate no arbitrage opportunity)
- which assets according to some (fundamental, technical etc.) factors to select or filter out from consideration
Next step in the pairs selection process is to do the proper analysis of prepared data. Here the questions are mainly:
- what approach or algorithm to use for similarity calculation – widely known and used are cointegration, correlation, regression etc.
- evaluate the pair robustness/power (total, in various periods)
- determine strictness of condition for pair identification
- how many pairs minimally is suitable to have in portfolio
- what to do with assets that take part in more pairs
- what role can play the upcoming fundamental events (fusion, bankruptcy etc.) in identified pair stability
After the crucial step of pairs selection the trading part of the strategy follows. It deals with determination of trading signals, e.g. define rules solving problems like:
- how much the assets in the pair should differ for opening the positions
- are there other relevant indicators disproving suitability of opening the planned position (long position planned and the RSI shows the overheated asset etc.)
- determine the ratio of assets in open positions
- what dissimilarity of assets should lead to close the positions
- how long to wait maximally for the spread returning to normal state or for closing the positions regardless to trade result (avoiding possible higher losses)
Naďa Chalupová